Recent Global Cooling Controversy

by metatron 236 Replies latest jw friends

  • bohm
    bohm

    mP:

    its also interesting that the graphs from one source of temps dont exactly match those of another. Different places have are different. For some its above avg in one year and yet hte othergraph shows the opposite.

    The Aus temp of 1940 is above avg while the American recording is below. The graphs are there for all too see.

    Indeed they are. Thats why scientists are distinguishing between weather and climate. For instance, the weather might be quite cold one day and very warm the next, or it might be very cold where you are and very warm somewhere else, both at the same time. If you feel up to more research today, you can consult the weather chanel on the TV to observe this fact.

    This does not mean the global heat content has changed rapidly, only that the weather is different at different times and at different locations.
  • mP
    mP

    Lets take another look at http://www.bom.gov.au/announcements/media_releases/climate/change/20130103.shtml

    Bureau of Meteorology data show that Australia had near-average rain and above-average temperatures during 2012, but the average annual values conceal a year of contrasts:

    • La Niña brought above-average rain early in 2012
    • Reduced rainfall in winter and spring was associated with a warm central Pacific Ocean and positive Indian Ocean Dipole
    • Annual nationally averaged rainfall very slightly above average, with 476 mm (1961–1990 average of 465 mm).
    • A warmer-than-average year, 0.11 °C above average
    • 2003–2012 the fifth-warmest 10-year period on record.

    MP:

    I will address each point one by one

    #1

    a fact no proof for GW just a statement.

    #2

    ok, not proof of anything

    #3

    2% increase so what /

    #4

    Which year is the average ? IThe other graphs show many years above 2012. Why not pick one of them as the avg ?

    #5

    How far back do these records go ? Is it the 5th hottest out of 50 years , aka the last or is it 5th hottest out of 10 decades aka the middle or 5 out of 200 years aka above 75% of years ?

    Not very impressive when you actually ask a few q.

  • mP
    mP

    Bohm:
    Can you accurately quote, put markers in the right place so we know where everybody's comment start and end. Surely your surperior knowledge can see this can lead to confusion.

  • mP
    mP

    Bohm:

    Indeed they are. Thats why scientists are distinguishing between weather and climate. For instance, the weather might be quite cold one day and very warm the next, or it might be very cold where you are and very warm somewhere else, both at the same time. If you feel up to more research today, you can consult the weather chanel on the TV to observe this fact.

    mP:

    Argh so it snot quite that clear cut. Lots of hype but the numbers are not quite as dramatic. I dont see how the weather channel helps this. The bimbos who read the numbers are just that bimbos reading numbers. They never quote or show graphs so we can see trends.

    Surely you have noticed this ?

  • bohm
    bohm

    mP:

    Secondly none of your charts prove that the pollution caused by humans is affecting the temp. If this was true, and im sure we can agree that pollution has been increasing at a steady rate the temp graph should also match this, but rather we have the absurd situation where 2010 avg is almost the same as years 100 years before.

    How exactly is this explained ? Reason with me ?

    Argument goes like this:

    (1) CO2 is going up due to man-made activity.

    (2) Global heat content is going up

    (3) There are good reasons to believe (1) will cause our observation (2) based on theory

    (4) The likely cause the temperature is going up is our activity.

    Since we are right now still at (2) arguing any of the other points make no sence.

    Besty answered the rest of your questions. The explanation is the (local) temperature for one year is a random variable, you could also carry your argument to the extreme by observing the (hourly) maximum temperature in 1910 was a lot higher than the (hourly) minimum of 2012; that wouldnt proove anything either.

    If you cant tell there is a trend you can look up basic linear regression and hypothesis testing and check it statistically, the kicker is there are people out there who have done that.

  • mP
    mP

    BOHM

    This does not mean the global heat content has changed rapidly, only that the weather is different at different times and at different locations.

    mP:

    Exactly, and how can inquisitive minds like me really judge its really that dramatic without basic numbers. It would appear that your having a hard time proving your Armagaddeon. Surely if it was mega hot the graphs shoold all be above average everywhere all the time most of th etime.

  • mP
    mP

    BOHM:

    Argument goes like this:

    (1) CO2 is going up due to man-made activity.

    (2) Global heat content is going up

    (3) There are good reasons to believe (1) will cause our observation (2) based on theory

    (4) The likely cause the temperature is going up is our activity.

    Since we are right now still at (2) arguing any of the other points make no sence.

    mP:

    Well youve just started, lets go.

    You have not proved that carbon is increasing the temps. I can show graphs before the IndRev that show temps going up. How do you explain those ?

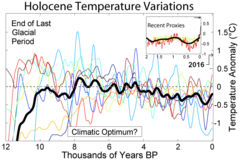
    Nothing is as simple as #4, the world is much more complex place. The fact i can show many graphs that show it was hotter in recent times a few 1000 years ago show your argument is bunk. Since man has been burning more and more trees, coal and petrol ever since the beginning of time, temps should match and yet they surprise surprise they dont.

    http://en.wikipedia.org/wiki/Temperature_record

    http://upload.wikimedia.org/wikipedia/commons/thumb/c/ca/Holocene_Temperature_Variations.png/240px-Holocene_Temperature_Variations.png

  • mP
    mP

    Bohm:

    If you cant tell there is a trend you can look up basic linear regression and hypothesis testing and check it statistically, the kicker is there are people out there who have done that.

    mP:

    Except 2000 years ago was about the same as now. 6000 was hotter by a fair bit etc. Not quite as simple as you make it.

  • mP
    mP

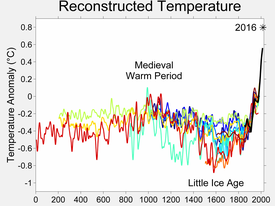
    http://en.wikipedia.org/wiki/Medieval_Warm_Period

    http://upload.wikimedia.org/wikipedia/commons/thumb/c/c1/2000_Year_Temperature_Comparison.png/275px-2000_Year_Temperature_Comparison.png

    Did the world die out and stop burning coal and wood between 1000-1800 ? Did they all freak out about global warming in 1000 and go green and raw veggies ?

    Funnily enough this graph shows a big increase from 1800 and yet othe graphs for 1900-2000 shown on this page and before dont show a linear increase but dependingon the year are almost flat. One graph shows 2010 to be the same as 1910 and yet the graph ive just shown above on this very post shows 2004 to be so far above 1900 its impossible.

  • bohm
    bohm

    mP: "You have not proved that carbon is increasing the temps"

    Again, you are just asking questions over and over again without bothering to look up the answers.

    it is called the greenhouse effect. you can find it on wikipedia.

    mP: "The fact i can show many graphs that show it was hotter in recent times a few 1000 years ago show your argument is bunk."

    So since it was hot in the past human activity cannot change global temperature. Awesome logic right there. Like, you might say, since the population of elephants has gone up and down in the past, human hunting of elephants cannot change the population.

    Also, you ought to show that graph to some climate scientists! I bet nobody has bothered to write anything about it which even a 10 year old could find with a single google query.

Share this

Google+
Pinterest
Reddit