MP->besty:
bohm does not know how to read, so bohm does its best, making claims that the figures dont support, and reverting to the name calling of little kids.
Betsy:
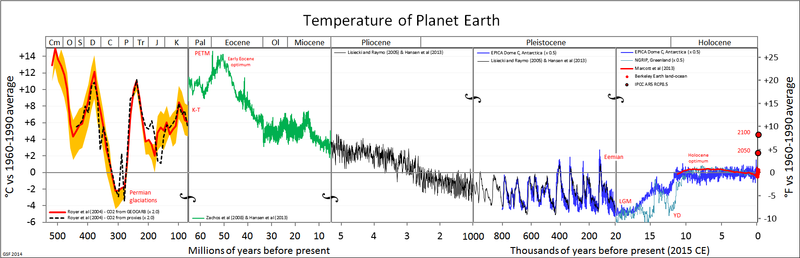
Are the grey boxes trending above or below the line as time progresses? Above/below/can't tell - your answer pls
mP:
Well to communicate effectively you need to state which graph your referring too. They are trending in most, but thats not what Bohm or Brinjen claimed. Im an exact person and if you look at what i have said, i read the text for what it says exactly. My comments reflect that.
If we go back a few hundred of thousand years, the same averages are also jumping about. So what do you make of that ???
Back on recent comments i made about reading the bom article about the last 100 years of averages.
IF the text says 5th hottest, then i need to know 5th out of what. Knowing the size makes all the difference. As i state, being 5th hottest when there are only 5 samples is not impressive. If we look at the graphs just on this page, then the 2000s are only 5th hottest out of 10, which is again just above average.
Whats impressive about being 5th hottest out of 10 ?
Im not speaking in riddles, im attempting to read exactly what the graph says and not inventing whatever the television tells me. I wouldnt trust a tv personality for medical advice about cancer, or this or that, because most of them are idiots who just read prompts. They make unsubstanitated claims about other matters all the time. I can read and i am trying to see the numbers myself. These same idiots host shows talent shows and tell us every new performer is the most talented ever and then next week they are superceeded by yet another best ever.
Betsy:
Are the grey boxes getting bigger or smaller? Bigger/Smaller/Can't tell - your answer pls
mP;
Yes theres a slight increase in the last 100 years. Then again the graph has been jumping about for thoustands of years.
You know very well im looking at the numbers instead of like a brain dead zombie who accepts everything demanded or lectured to me. They are getting bigger in some graphs in others they are not. If we look back a 100 or 1000 years we also see fluctuations. Its been happening since the beginning of time. Its also too easy to think we know how everything works and claim its CO2 and its man made. Like i showed BOHM a few posts back, it was warmer many times just a few houtsand years ago and we didnt have man and we didnt have factories. Im not saying i know or have all the answers, but only a fool thinks they know everything.
Lets hope Bohm will address this last issue rather than repeating the same standard response, which is getting tired and requires no effort or thought.
Claiming its the end of the world and we are going to drown because of man made co2 is just too easy. I originally said, governments have done next to nothing to combat CC and i stand by that. I have yet to see any dramatic change in any policy relating to consumption of fossil fuels. We are using plastics and petrol at record rates. None of this has changed. Its been 10 years thats a lot of time, something could have happened, if there was a will.